16. Appendix.06: TDB Guidance
This chapter mainly introduces the use of the Tensor Debugger(TDB) tool. TDB provides a debugging window similar to pdb and gdb interfaces, which can be used to debug the BModel running process, including adding breakpoints, single-step execution, viewing memory data, data comparison, and other functions.
This tool currently supports BM1684, BM1684X, and BM1688.
16.1. Preparatory work
Environment configuration
First you need to refer to Environment Setup chapter to complete the environment configuration, enter the Docker container of TPU-MLIR, and install tpu_mlir in it.
If you have completed the environment configuration, you can ignore this step.
Generate bmodel
Before using TDB, you need to generate the bmodel file through TPU-MLIR, refer to Compile the ONNX model chapter to generate the bmodel file from the model.
You need to use the following two commands:
# Convert the ONNX model to top_mlir
$ model_transform
# Convert top_mlir to bmodel
$ model_deploy
Here, the model_deploy command needs to add --debug and --compare_all arguments to save the tpu_output.npz file and keep the intermediate data.
When the bmodel is built, a directory with the compilation.bmodel and final.mlir files is automatically generated, this directory is called the Context directory.
16.2. Start TDB
$ tdb [-h]
      [--inputs [INPUTS]]
      [--ref_data [REF_DATA ...]]
      [--plugins [PLUGINS]]
      [--ddr_size [DDR_SIZE]] [-v]
      [context_dir]
The main parameters of the tdb command are described as follows:
Name |
Required? |
Explanation |
|---|---|---|
context_dir |
Y |
The directory where the bmodel file resides, which is the current directory by default |
-h, –help |
N |
Display help information |
–inputs |
N |
Specify input data for the bmodel file |
–ref_data |
N |
Specify reference data for the bmodel file |
–plugins |
N |
Add extra plugins |
–ddr_size |
N |
Specify the ddr_size of the cmodel |
-v, –verbose |
N |
Use the progress bar |
Example of starting TDB:
$ tdb
# equivalent to
$ tdb ./
16.3. TDB command summary
After entering TDB, press tab twice to get the command prompt. The display looks like this:
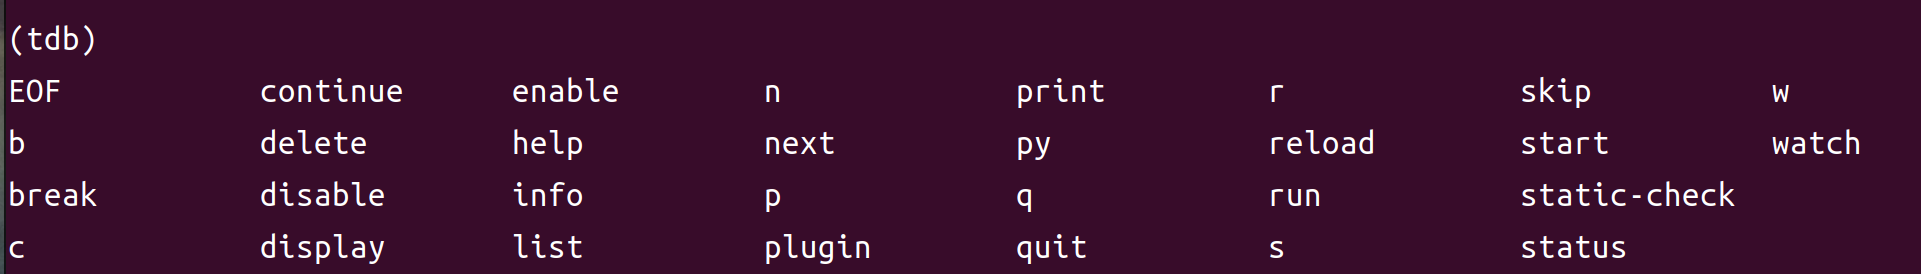
After entering TDB, the following commands can be used:
Command |
Explanation |
|---|---|
s/start |
Load the bmodel and initialize it |
r/run |
Execute from the beginning to the end, the run instruction contains the initialization function |
b/break |
Add breakpoints in final.mlir |
delete |
Delete breakpoint |
n/next |
Execute the next instruction, you can use |
c/continue |
Continue the instruction until the break point or the end of the run |
info |
Print breakpoint information or instructions in different formats |
p/print |
Print the current instruction or the data corresponding to the instruction |
w/watch |
Monitors a certain input/output of the current or previous atomic instruction and returns a prompt when the data at its address changes |
q/quit |
Quit TDB |
py [py_cmd] |
Execute python commands in TDB, integrated with pdb’s code completion function |
Where num represents number; py_cmd denotes the python command.
16.4. TDB usage process
# start TDB in context directory
$ cd path/to/context_dir
$ tdb
# initialize
$ s
# execute line by line
$ n
# add breakpoint
$ b
# keep running
$ c
# continue debugging
$ info/p/w
# quit
$ q
16.5. TDB function description
16.5.1. next feature
# execute line by line use next
(tdb) n
# execute multiple instructions
(tdb) n [num]
# execute 3 instructions
(tdb) n 3
The instruction displayed after the n command is the next unexecuted instruction.
16.5.2. breakpoint feature
Breakpoint feature include viewing breakpoints, adding/removing breakpoints, and turning breakpoints on/off. Here’s how to use it:
Command |
Explanation |
Example |
|---|---|---|
info b/break |
View breakpoint information |
info b; info break |
b/break |
Add breakpoint |
b 1 |
enable |
Enable breakpoint |
enable 1; enable 1,2 |
disable |
Disable breakpoint |
disable 1; disable 1,2 |
delete |
Delete breakpoint |
delete 1 |
Currently supported breakpoint types are as follows:
value-id
The Operation prefix in final.mlir corresponding to bmodel, for example:
%140 = "tpu.Load"(%6) {do_bcast = false …
where %140 and %6 are value-id , adding this type of breakpoint example is as follows:
(tdb) b %140
(tdb) b %6
op-name
The Operation name in final.mlir , in the above example, tpu.Load is the Op name, add this type of breakpoint example is as follows:
(tdb) b tpu.Load
cmd-id
The cmd-id of asm which is resolved. In the above example, D1 and B0 are cmd-id . The example of adding this type of breakpoint is as follows:
(tdb) b D2
(tdb) b B4
16.5.3. info feature
The info feature can print breakpoint information or instructions in different formats as follows:
info b
View breakpoint information.
(tdb) info b
index     type enable     text hit
    1  dialect      y tpu.load   0
    2     addr      y       R0   3
    3   cmd-id      y       D1   0
    4 value-id      y       %7   0
info asm
Show the current asm instruction.
(tdb) info asm
%R0, %B15 = "arith.add"(%R13, %C1.0, %D3) {round_mode = 0} : (memref<1x32x54x160xf32, strides: [8640, 8640, 160, 1]>, f32, none) -> (memref<1x32x54x160xf32, strides: [8640, 8640, 160, 1]>, none)
info mlir
Show the Operation in final.mlir that corresponds to the current instruction.
(tdb) info mlir
%137 = "tpu.Active"(%134) {ginfo = #tpu.lg<out_addr = 212992, out_size = 35456, buffer_addr = 0, buffer_size = 71040, eu_align = true, n_idx = [0], n_slice = [1], c_idx = [0], c_slice = [32], d_idx = [0], d_slice = [1], h_idx = [0, 53, 107, 161, 215, 267], h_slice = [54, 55, 55, 55, 53, 53], w_idx = [0, 159], w_slice = [160, 161], id = 6, stage = 1, group_type = 0>, mode = #tpu<active_mode SILU>} : (tensor<1x32x320x320xf32>) -> tensor<1x32x320x320xf32> loc(#loc19)
info reg
Show the value of each field after the current command has been parsed.
(tdb) info reg
{'cmd_short': 1, 'cmd_id': 15, 'cmd_id_dep': 3, 'tsk_typ': 3, 'tsk_eu_typ': 2, 'opd0_const': 0, 'opd1_const': 1, 'opd2_const': 0, 'tsk_opd_num': 2, 'cmd_id_en': 1, 'pwr_step': 0, 'intr_en': 0, 'res0_prec': 2, 'opd0_prec': 2, 'opd1_prec': 2, 'opd2_prec': 0, 'opd0_sign': 1, 'opd1_sign': 1, 'res0_str': 0, 'opd0_str': 0, 'opd1_str': 0, 'opd2_n_str': 0, 'rsvd0': 0, 'res0_n': 1, 'res0_c': 32, 'res0_h': 54, 'res0_w': 160, 'res0_addr': 0, 'opd0_addr': 212992, 'opd1_addr': 1065353216, 'opd2_addr': 0, 'res0_n_str': 0, 'res0_c_str': 0, 'opd0_n_str': 0, 'opd0_c_str': 0, 'opd1_n_str': 0, 'opd1_c_str': 0, 'res0_h_str': 0, 'res0_w_str': 0, 'opd0_h_str': 0, 'opd2_sign': 0, 'rsvd1': 0, 'opd0_w_str': 0, 'opd1_h_str': 0, 'opd1_w_str': 0, 'rsvd2': 0}
info loc
Show the corresponding Operation information of tensor_location.json in the Context directory.
(tdb) info loc
{'core_id': 0,
'file_line': 27,
'loc_index': 4,
'opcode': 'tpu.Active',
'operands': [@163840({name=122_Conv, layout=eu_align, slice=[0:1, 0:32, 0:1, 0:54, 0:160], mlir_type=tensor<1x32x320x320xf32>, memory_type=<1x32x54x160xf32>})],
'results': [@212992({name=124_Mul, layout=eu_align, slice=[0:1, 0:32, 0:1, 0:54, 0:160], mlir_type=tensor<1x32x320x320xf32>, memory_type=<1x32x54x160xf32>})],
'slice_all': False,
'subnet_id': 0,
'tiu_dma_id_after': [17, 3],
'tiu_dma_id_before': [1, 3]}
16.5.4. print feature
The print feature not only prints the current asm instruction, but also the input and output data of the instruction, the method of use is as follows:
Command |
Explanation |
Example |
|---|---|---|
p op |
Show upcoming commands |
p op |
p pre/next |
Show the previous or next instruction |
p pre; p next |
p in |
Show the input data for the next unexecuted instruction |
p in; p in 0 |
p out |
Show the output data of the previous executed instruction |
p out; p out 0 |
16.5.5. watchpoint feature
The watchpoint feature can monitor the input/output data of an instruction and return an alert when the data of a monitored variable changes, the method of use is as follows:
w
Show the currently added watchpoints, see the following example:
(tdb) w
index    cmd_type cmd_id core_id enabled                                                   value
    1 CMDType.dma      2       0       y %G0: memref<1x32x3x36xf32, strides: [3456, 108, 36, 1]>
w in
Adds one of the inputs for the next pending instruction as a watchpoint, see the following example:
(tdb) n
%R15.2688, %D2 = "dma.tensor"(%G0, %B0) {decompress = False} : (memref<1x32x3x36xf32, strides: [3456, 108, 36, 1]>, none) -> (memref<1x32x3x36xf32, strides: [108, 108, 36, 1]>, none)
(tdb) w in 0
(tdb) w
index    cmd_type cmd_id core_id enabled                                                   value
    1 CMDType.dma      2       0       y %G0: memref<1x32x3x36xf32, strides: [3456, 108, 36, 1]>
as you can see, w in 0 adds the first input %G0 of the next pending instruction as watchpoint.
w out
Adds one of the outputs of the last executed instruction as a watchpoint, see the following example:
(tdb) w out 0
(tdb) w
index    cmd_type cmd_id core_id enabled                                                         value
    1 CMDType.dma      2       0       y       %G0: memref<1x32x3x36xf32, strides: [3456, 108, 36, 1]>
    2 CMDType.dma      1       0       y %R0: memref<1x3x110x322xf32, strides: [35424, 35424, 322, 1]>
p w idx old/now
Prints the value of the added watchpoint, as shown in the following example:
Where idx is the index of the watchpoint returned using the w command, old means to view the data when the watchpoint was originally added, and now means to view the current data of the watchpoint.
The old/now can be omitted and the default is now, which means view the current data of the watchpoint.
(tdb) w
index    cmd_type cmd_id core_id enabled                                                         value
    1 CMDType.dma      2       0       y       %G0: memref<1x32x3x36xf32, strides: [3456, 108, 36, 1]>
    2 CMDType.dma      1       0       y %R0: memref<1x3x110x322xf32, strides: [35424, 35424, 322, 1]>
(tdb) p w 1
(tdb) p w 1 old
w delete [idx]
Deletes the added watchpoint, as shown in the following example:
When idx is entered, the corresponding watchpoint will be deleted; when idx is not entered, all watchpoints will be deleted.
(tdb) w
index    cmd_type cmd_id core_id enabled                                                         value
    1 CMDType.dma      2       0       y       %G0: memref<1x32x3x36xf32, strides: [3456, 108, 36, 1]>
    2 CMDType.dma      1       0       y %R0: memref<1x3x110x322xf32, strides: [35424, 35424, 322, 1]>
    3 CMDType.tiu     11       0       y %R13: memref<1x32x54x160xsi16, strides: [8640, 8640, 160, 1]>
(tdb) w delete 1
(tdb) w
index    cmd_type cmd_id core_id enabled                                                         value
    2 CMDType.dma      1       0       y %R0: memref<1x3x110x322xf32, strides: [35424, 35424, 322, 1]>
    3 CMDType.tiu     11       0       y %R13: memref<1x32x54x160xsi16, strides: [8640, 8640, 160, 1]>
(tdb) w delete
(tdb) w
index cmd_type cmd_id core_id enabled value
16.5.6. py feature
The py feature can execute python commands directly in the TDB environment, the method of use is as follows:
(tdb) py a = 2
(tdb) py b = a + 2
(tdb) py print(b)
4
16.6. BModel Disassembler
BModel Disassembler can disassemble the bmodel file to get the assembly code of atomic instruction in MLIR format, which is asm instruction. They are used to analyze the final runtime instruction of the model.
When you use it, you need to enter the Context directory first, and the method of use is as follows:
$ bmodel_dis [-h] [--format {mlir,reg,bits,bin,reg-set}] bmodels [bmodels ...]
where --format can specify the output format, which default use mlir format, bmodels means the bmodel file to be parsed. Example usage is as follows:
$ bmodel_dis compilation.bmodel
$ bmodel_dis --format reg compilation.bmodel
The output can be saved to a file as follows:
$ bmodel_dis compilation.bmodel > dis_bmodel.mlir
$ bmodel_dis --format reg compilation.bmodel > dis_reg.json
16.7. BModel Checker
BModel Checker is used to find errors (codegen errors) in a bmodel, if during model_deploy you find that the generated bmodel cannot be aligned with the tpu’s reference data, you can use this tool to locate the error.BModel for BM1684, BM1684X, BM1688 processors is currently supported.
When generating a bmodel file, the model_deploy command needs to add the --debug and -compare_all parameters, which are used to save the tpu_output.npz file and retain intermediate data.
The usage is as follows:
$ bmodel_checker [-h]
                 [--tolerance TOLERANCE]
                 [--report REPORT] [--fail_fast]
                 [--quiet] [--no_interactive]
                 [--dump_mode {failed,all,never}]
                 [--ref]
                 context_dir reference_data
The main parameters of bmodel_checker are described as follows:
Name |
Required? |
Explanation |
|---|---|---|
context_dir |
Y |
bmodel file directory |
reference_data |
Y |
tpu_output.npz file location |
quiet |
N |
The execution progress bar is not displayed |
fail_fast |
N |
Stop at the first error |
dump_mode |
N |
Specifies the data to be downloaded by the dump command, the default value is failed, it can also be all or never |
ref |
N |
Specifies using reference data(from tpu_output.npz) to inference all op. Default is false |
tolerance |
N |
Specify comparison tolerances, default is “0.99,0.90” |
report |
N |
Save the wrong data to file, default is |
no_interactive |
N |
After running bmodel_checker, it exits TDB mode directly |
cache_mode |
No |
Cache mode, with three options: online, offline, generate. Default is online. |
To use bmodel_checker you need to enter the Context directory, as shown in the following example:
$ bmodel_checker ./ ../yolov5s_bm1684x_f32_tpu_outputs.npz
$ bmodel_checker ./ ../yolov5s_bm1684x_f32_tpu_outputs.npz --fail_fast
$ bmodel_checker ./ ../yolov5s_bm1684x_f32_tpu_outputs.npz --tolerance 0.99,0.90
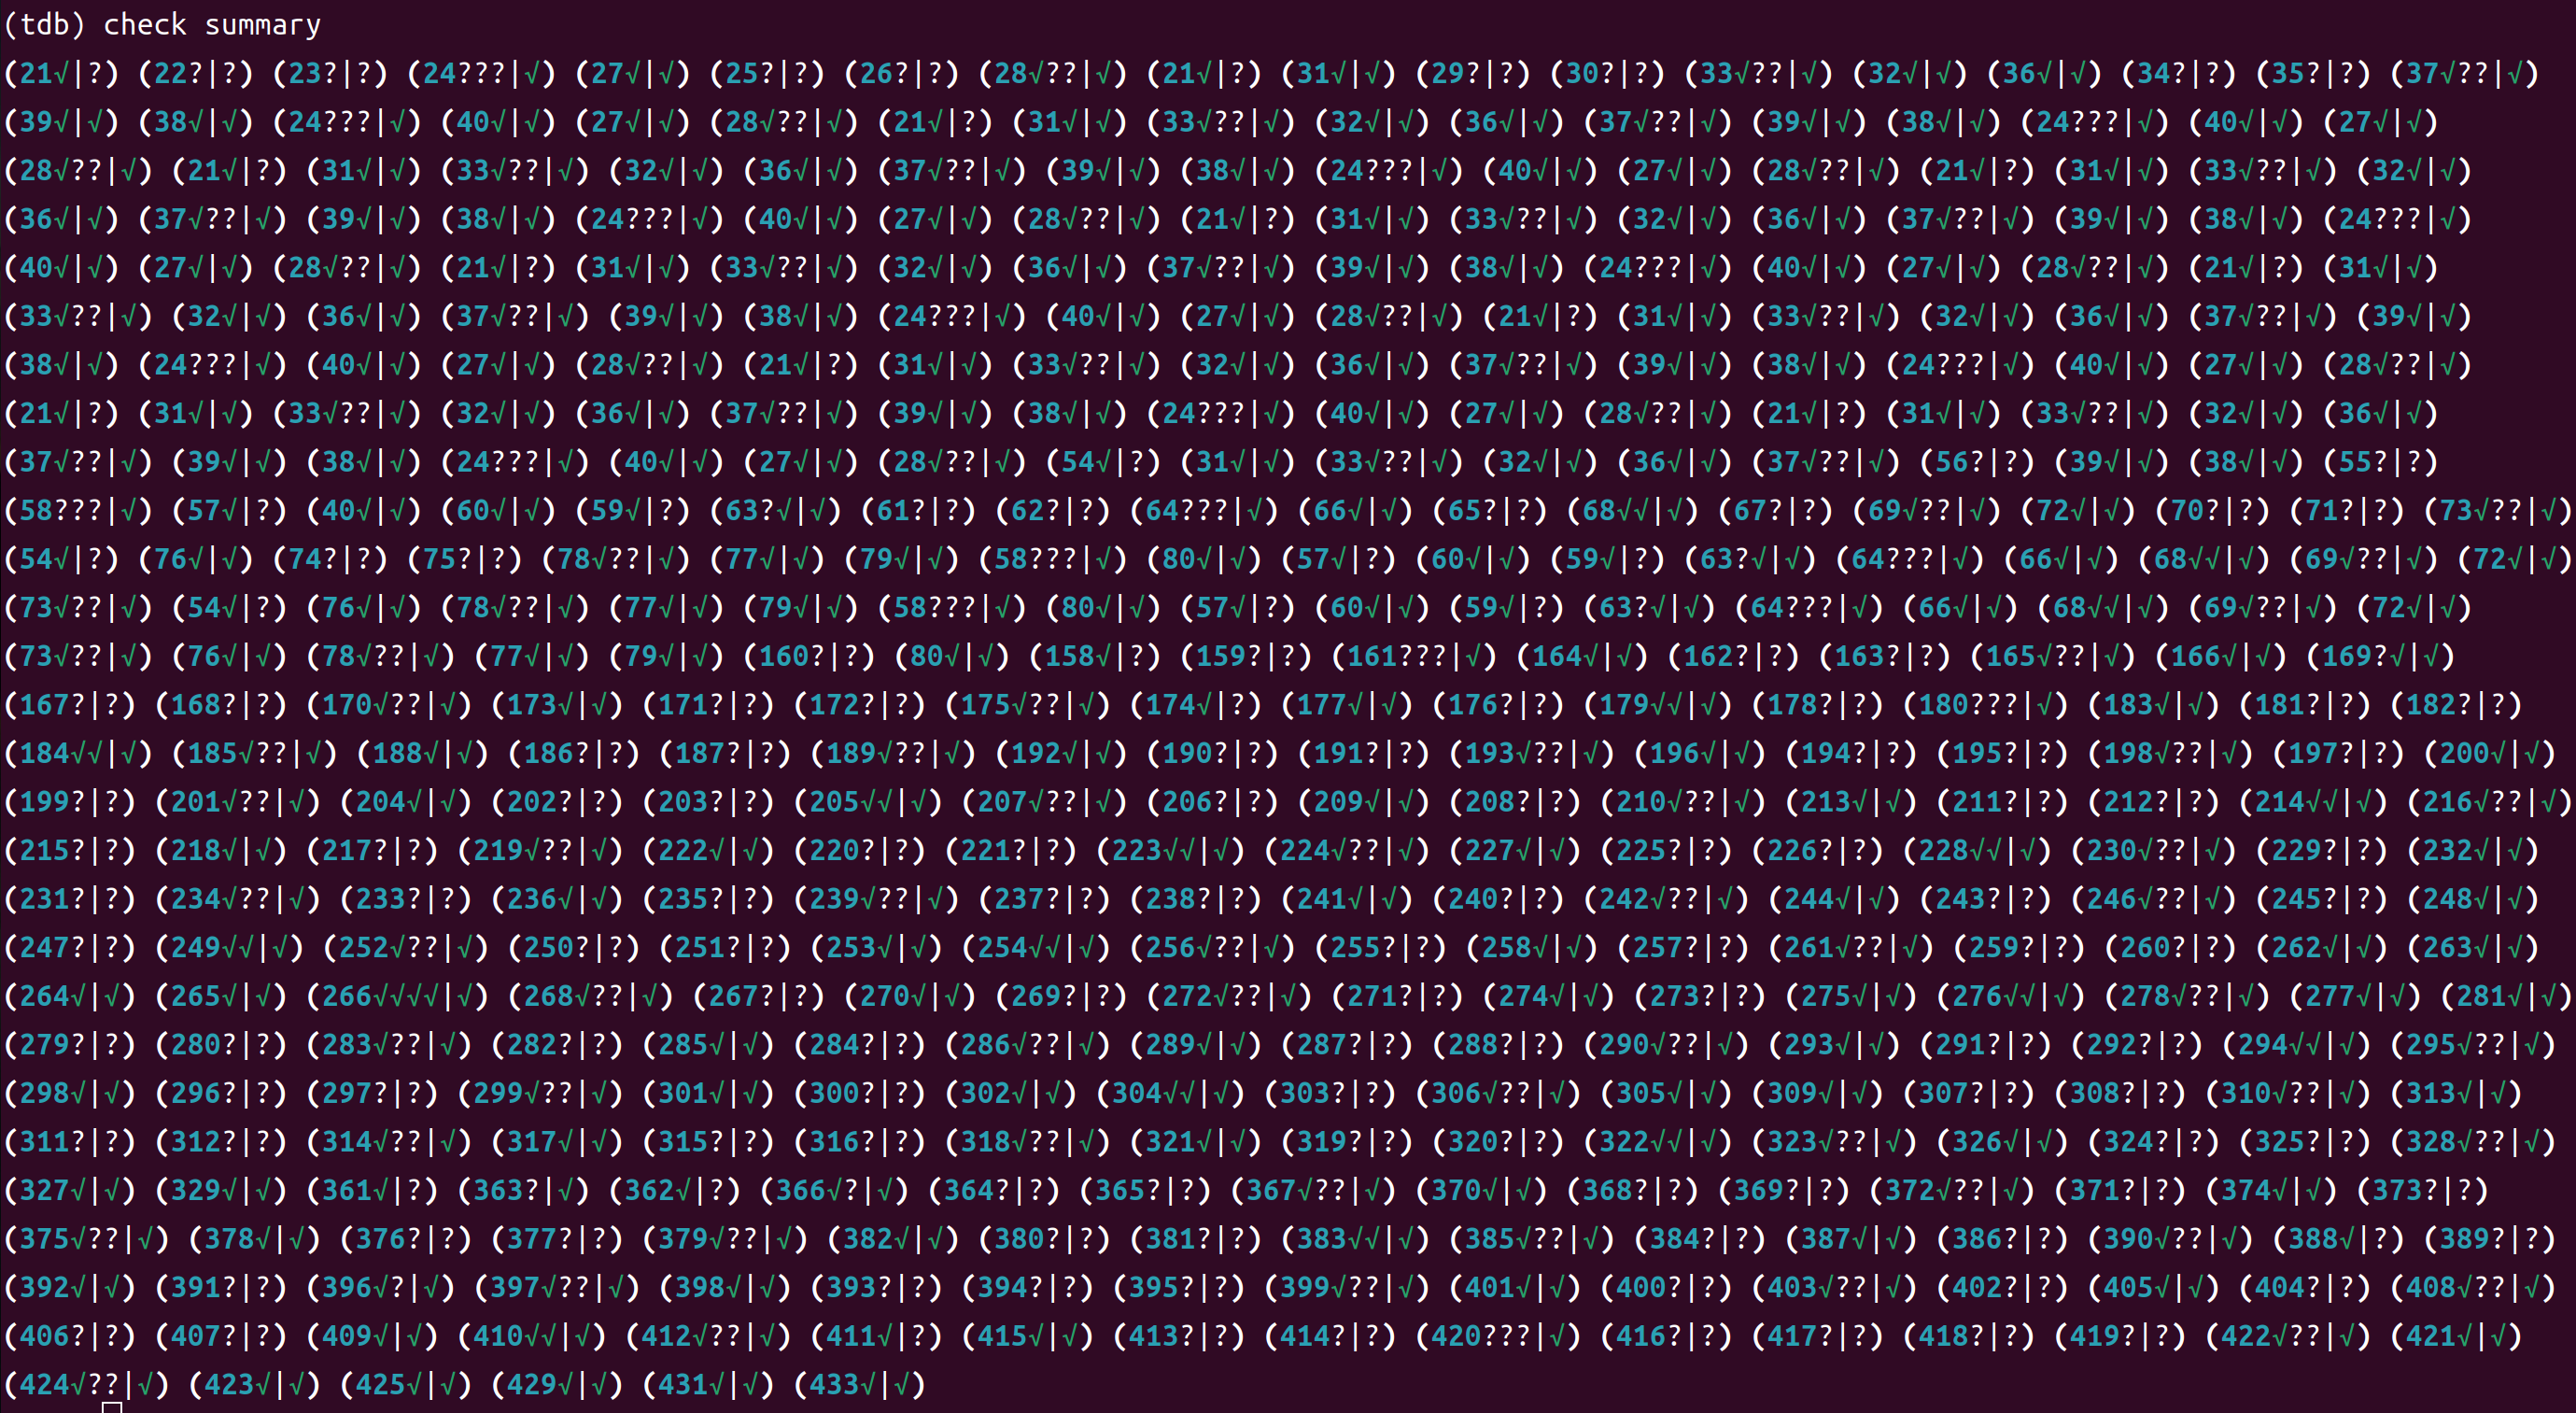
After executing the bmodel_checker command, the checker report is output and the error outputs are saved to the failed_bmodel_outputs.npz file, which is described below:
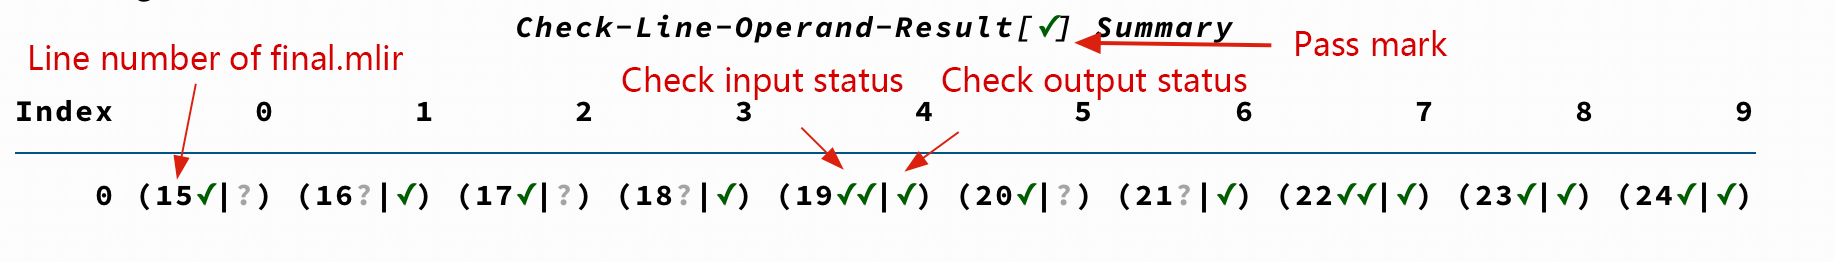
where the “check” means pass, which the data is checked and its similarity conforms to cos > 0.99, eul > 0.9 (This is the default threshold, which can be modified by the tolerance parameter); The “cross” means an error, which the data does not reach the required similarity; The “question mark” means an unknown, which the reference data is not found and the correctness of the data cannot be determined. A complete checker report of a yolov5s model is shown below:
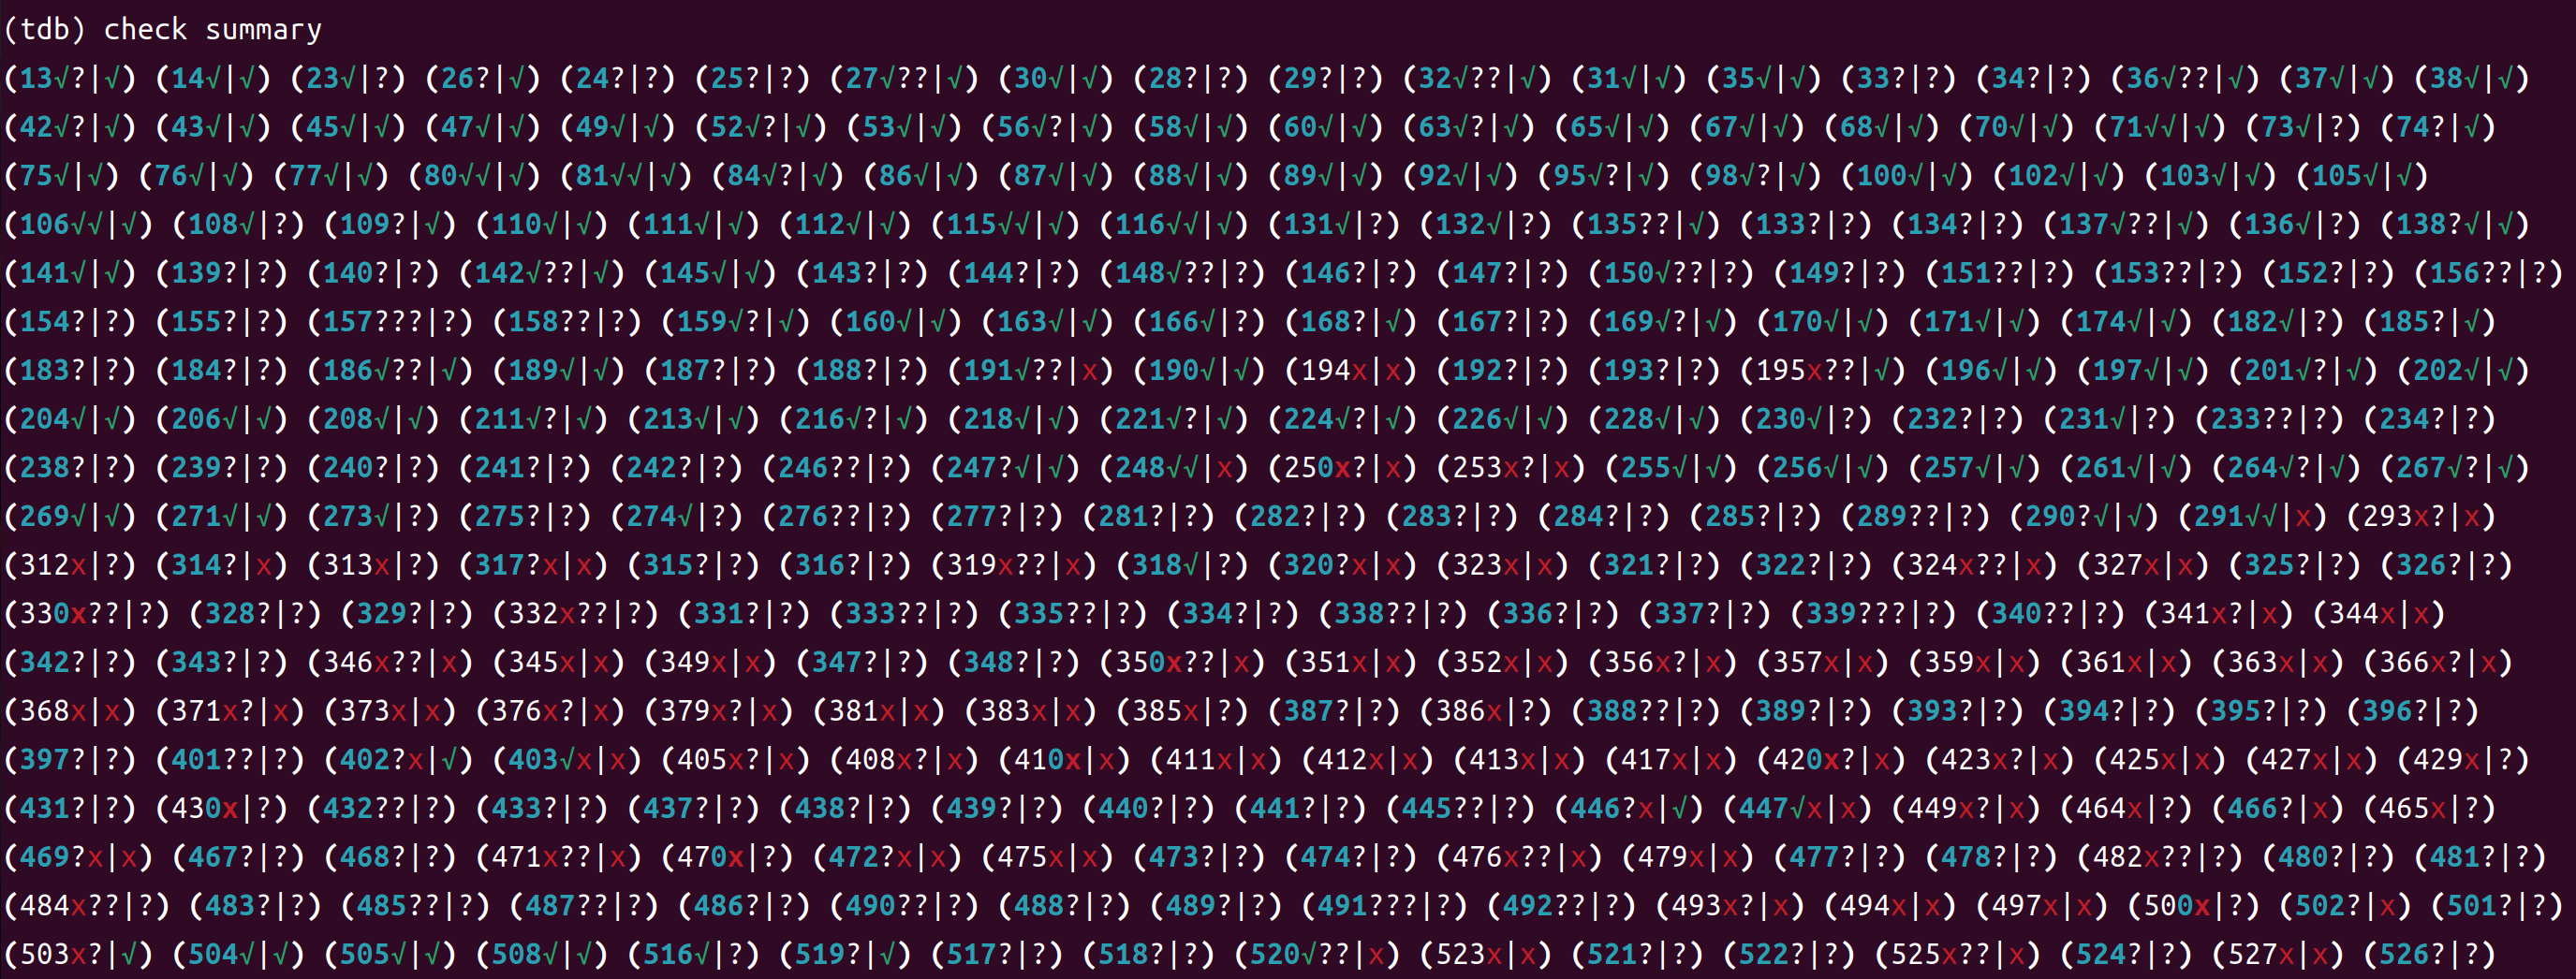
After outputting the check report, it automatically enters the interactive mode. The interactive mode provides a detailed view of the errors and also allows you to quickly jump between lines, as shown in the following example of a cswin_tiny model.
check summary
The check report can be reprinted by using the check summary command:
It is worth noting that you can aggregate inputs and outputs with the same line numbers using the check summary reduce command.
check data
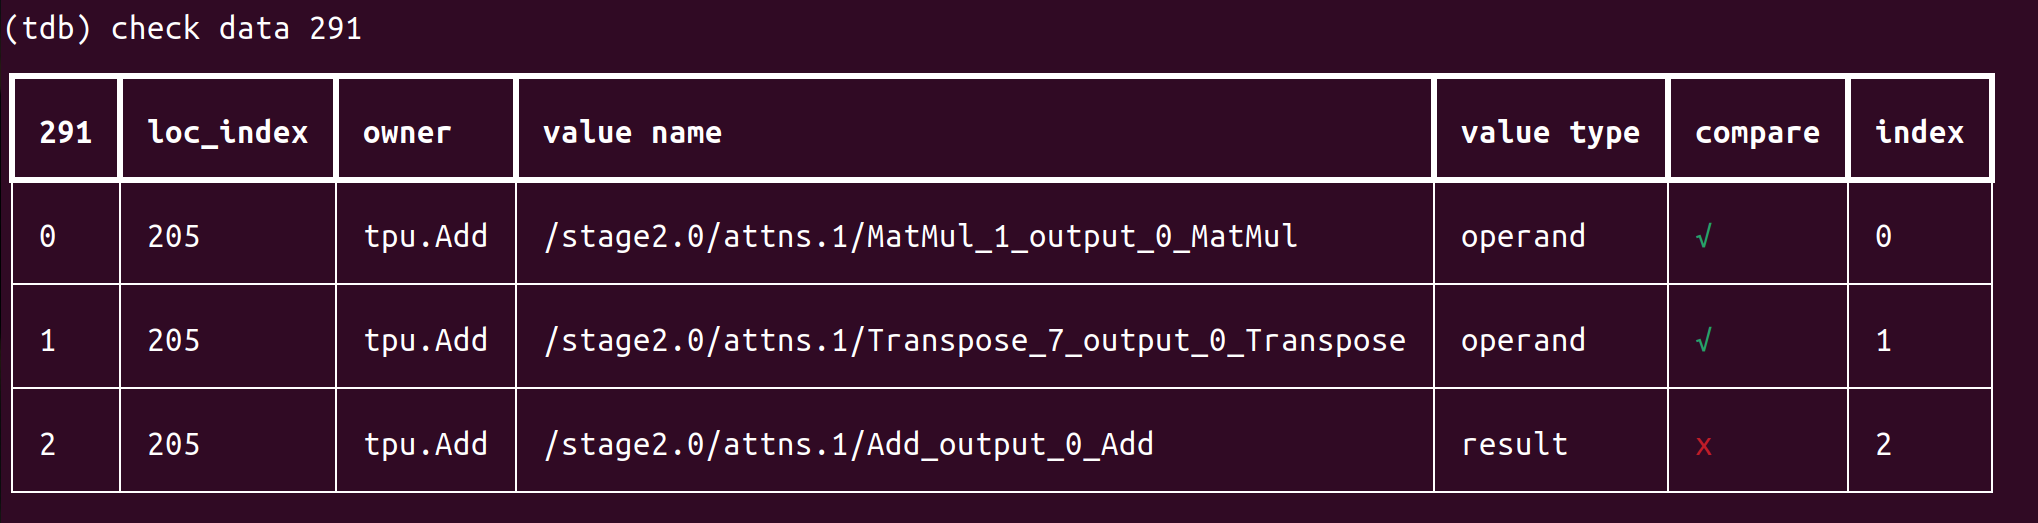
(tdb) check data [file-line]
where file-line is the line number in the checker report, which corresponds to the line number of final.mlir . This command gives a description of all the input and output data of the command corresponding to file-line, an example is shown below:
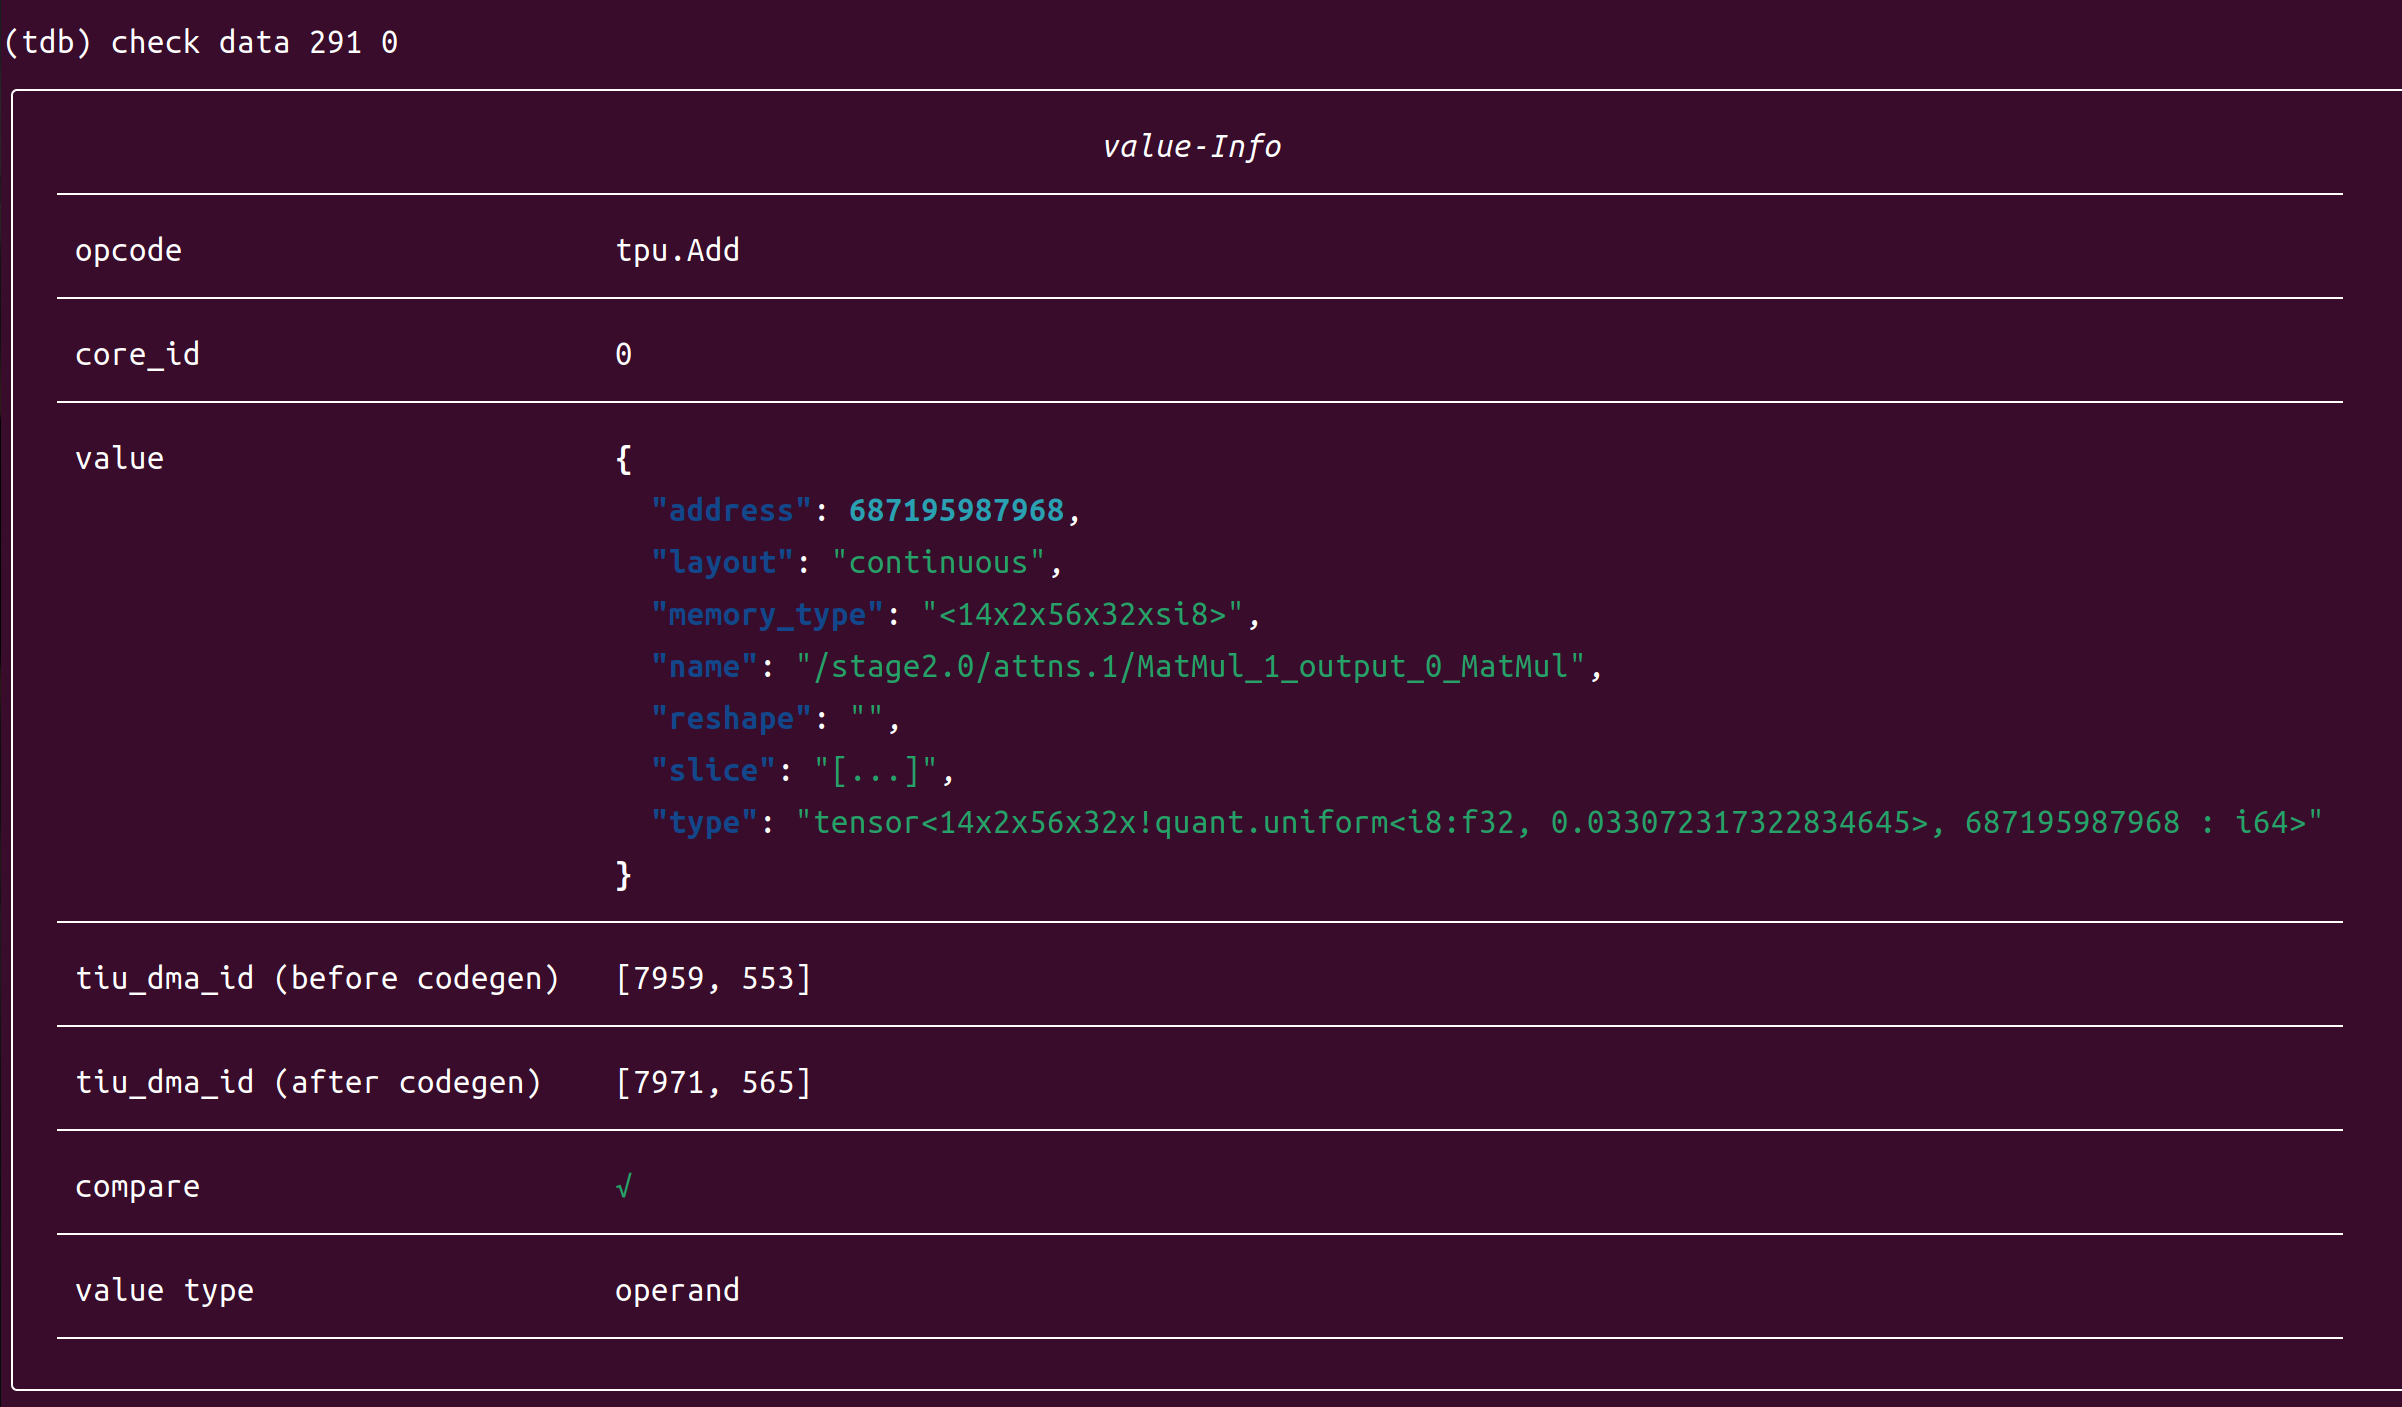
(tdb) check data [file-line] [index]
Where index is the index of the data output by the check data [file-line] command. This command gives detailed information about the corresponding index data, and an example of comparing the correct data is shown below:
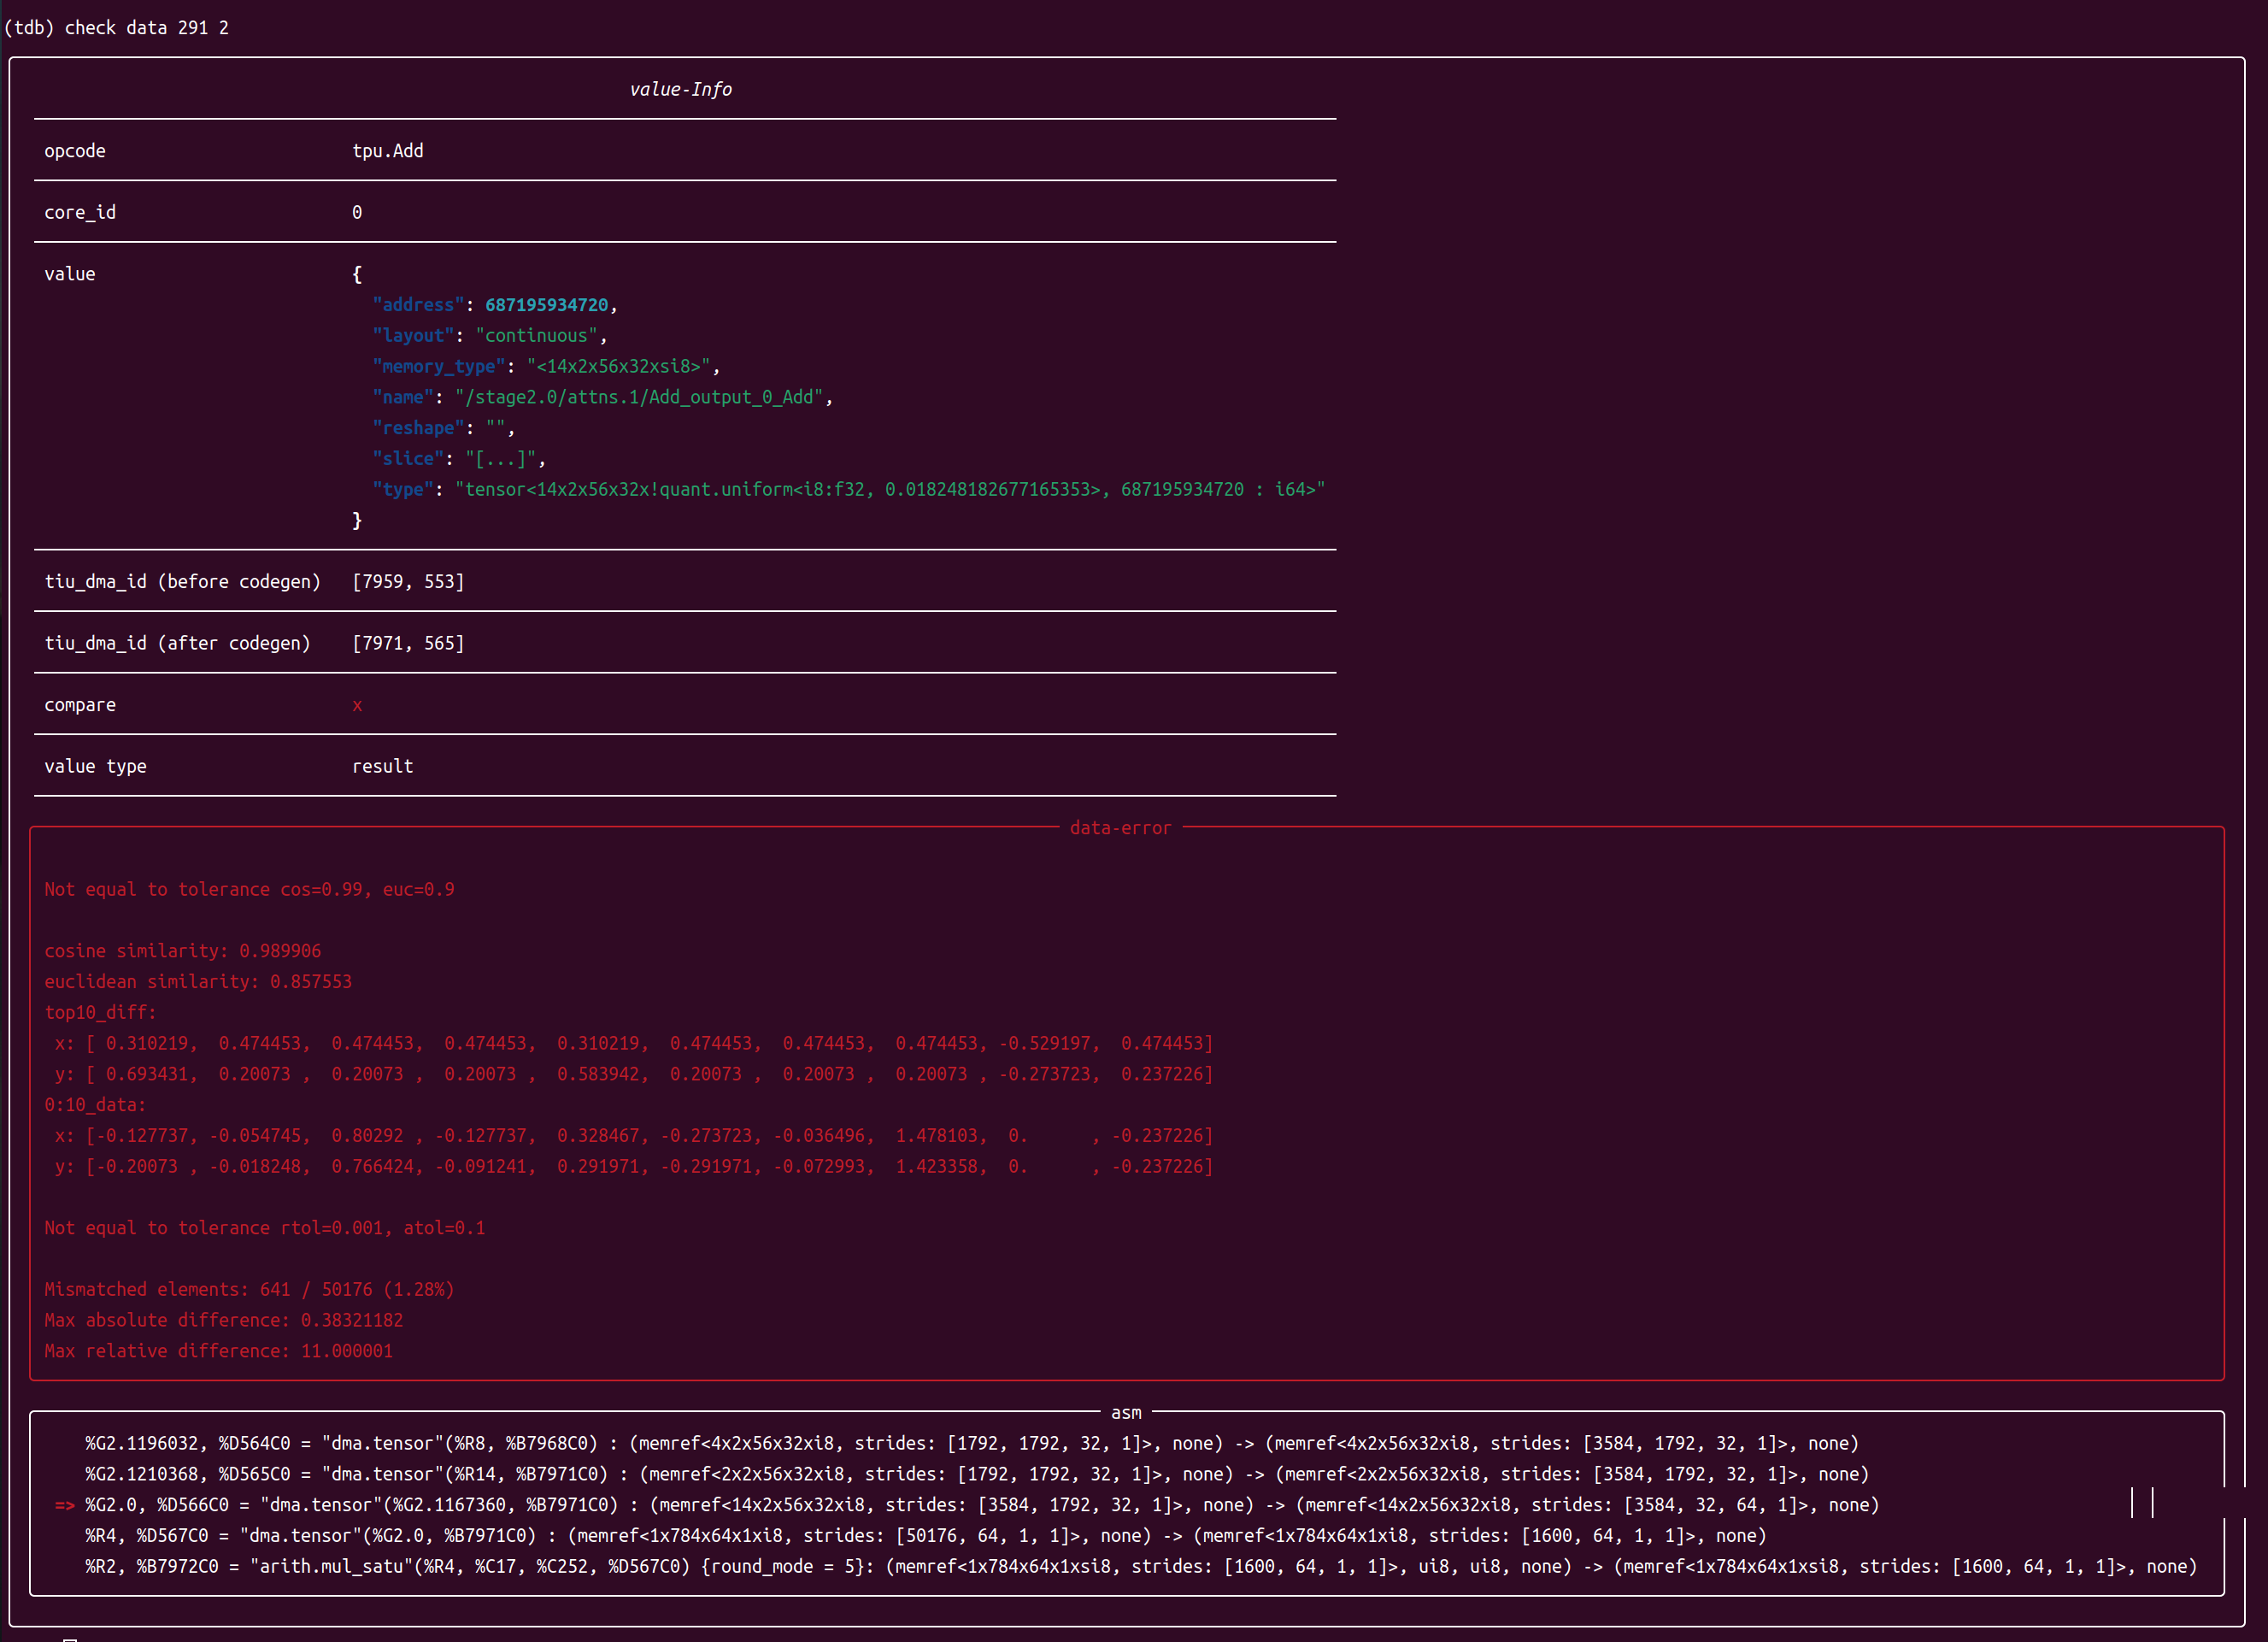
An example of comparison error data is shown below:
check ref
To use check ref command using reference data to inference again, which allows inspecting all problematic operators in the network。
(tdb) check ref
After re-inference, you can normally use other functions such as viewing the data results.
check diff
To use check diff command can visualize the difference of data.
(tdb) check diff [file-line] [index]
Save the visualization results of the actual data, reference data, and difference data as ./*actual.png, ./*ref.png, ./*diff.png.
SoC Devices
When executing on SoC devices, in order to perform comparisons without introducing an mlir dependency, it is necessary to first generate a cache within a Docker environment. Subsequently, the cached model can be used for comparison in the SoC device environment.
$ bmodel_checker ./ ../yolov5s_bm1684x_f32_tpu_outputs.npz --cache_mode generate # on docker
$ bmodel_checker ./ ../yolov5s_bm1684x_f32_tpu_outputs.npz --cache_mode offline # on soc